From raw product events to account decisions
SaaS Tracker takes product activity, revenue context, and AI cost events and turns them into account-level views your team can act on — a daily cockpit for B2B SaaS founders, product, and customer success.
The trial starts when your first data arrives — not when you create your account.
The daily account flow
How SaaS Tracker turns events into answers your team uses every morning.
What happened in each account?
Recent activity, trials, and product events rolled up by customer organization.
Is the account healthy, inactive, risky, or expanding?
Health scores and signals show which accounts need attention today.
What features and workflows explain that?
Feature adoption by organization — see what healthy accounts use and what at-risk accounts miss.
What AI cost and margin signals belong to that account?
AI spend by customer, feature, model, and plan — next to MRR and usage context.
Who should we contact next?
Prioritized account lists: revenue at risk, inactive paying, expansion candidates.
AI Cost & Margin Analytics
See which customers and AI features affect your margin
Track AI cost per customer account, feature, workflow, model, and plan. Connect LLM spend to MRR, packaging, and customer profitability — metadata only, no prompts stored, no gateway required.
- AI cost by customer, feature, model, and provider
- AI cost vs plan / MRR / customer tier
- Margin-risk accounts and cost spikes
- Value signals: accepted, rejected, edited outputs
One account-level story
AI Cost uses customer_org_id like the rest of SaaS Tracker — product usage, health, revenue, and AI spend in one cockpit.
Account intelligence, not generic analytics
Every view starts with the customer organization — how B2B SaaS teams actually sell, renew, and expand.
Account activity
Organization-level activity trends, recency, and recent events.
Customer health
Configurable health models — active, inactive, at-risk, expanding.
Feature adoption
Which features and workflows each account uses.
Revenue context
MRR, ARR, plan tier, and Revenue × Health prioritization.
AI margin
AI cost vs MRR, margin-risk accounts, cost by feature and model.
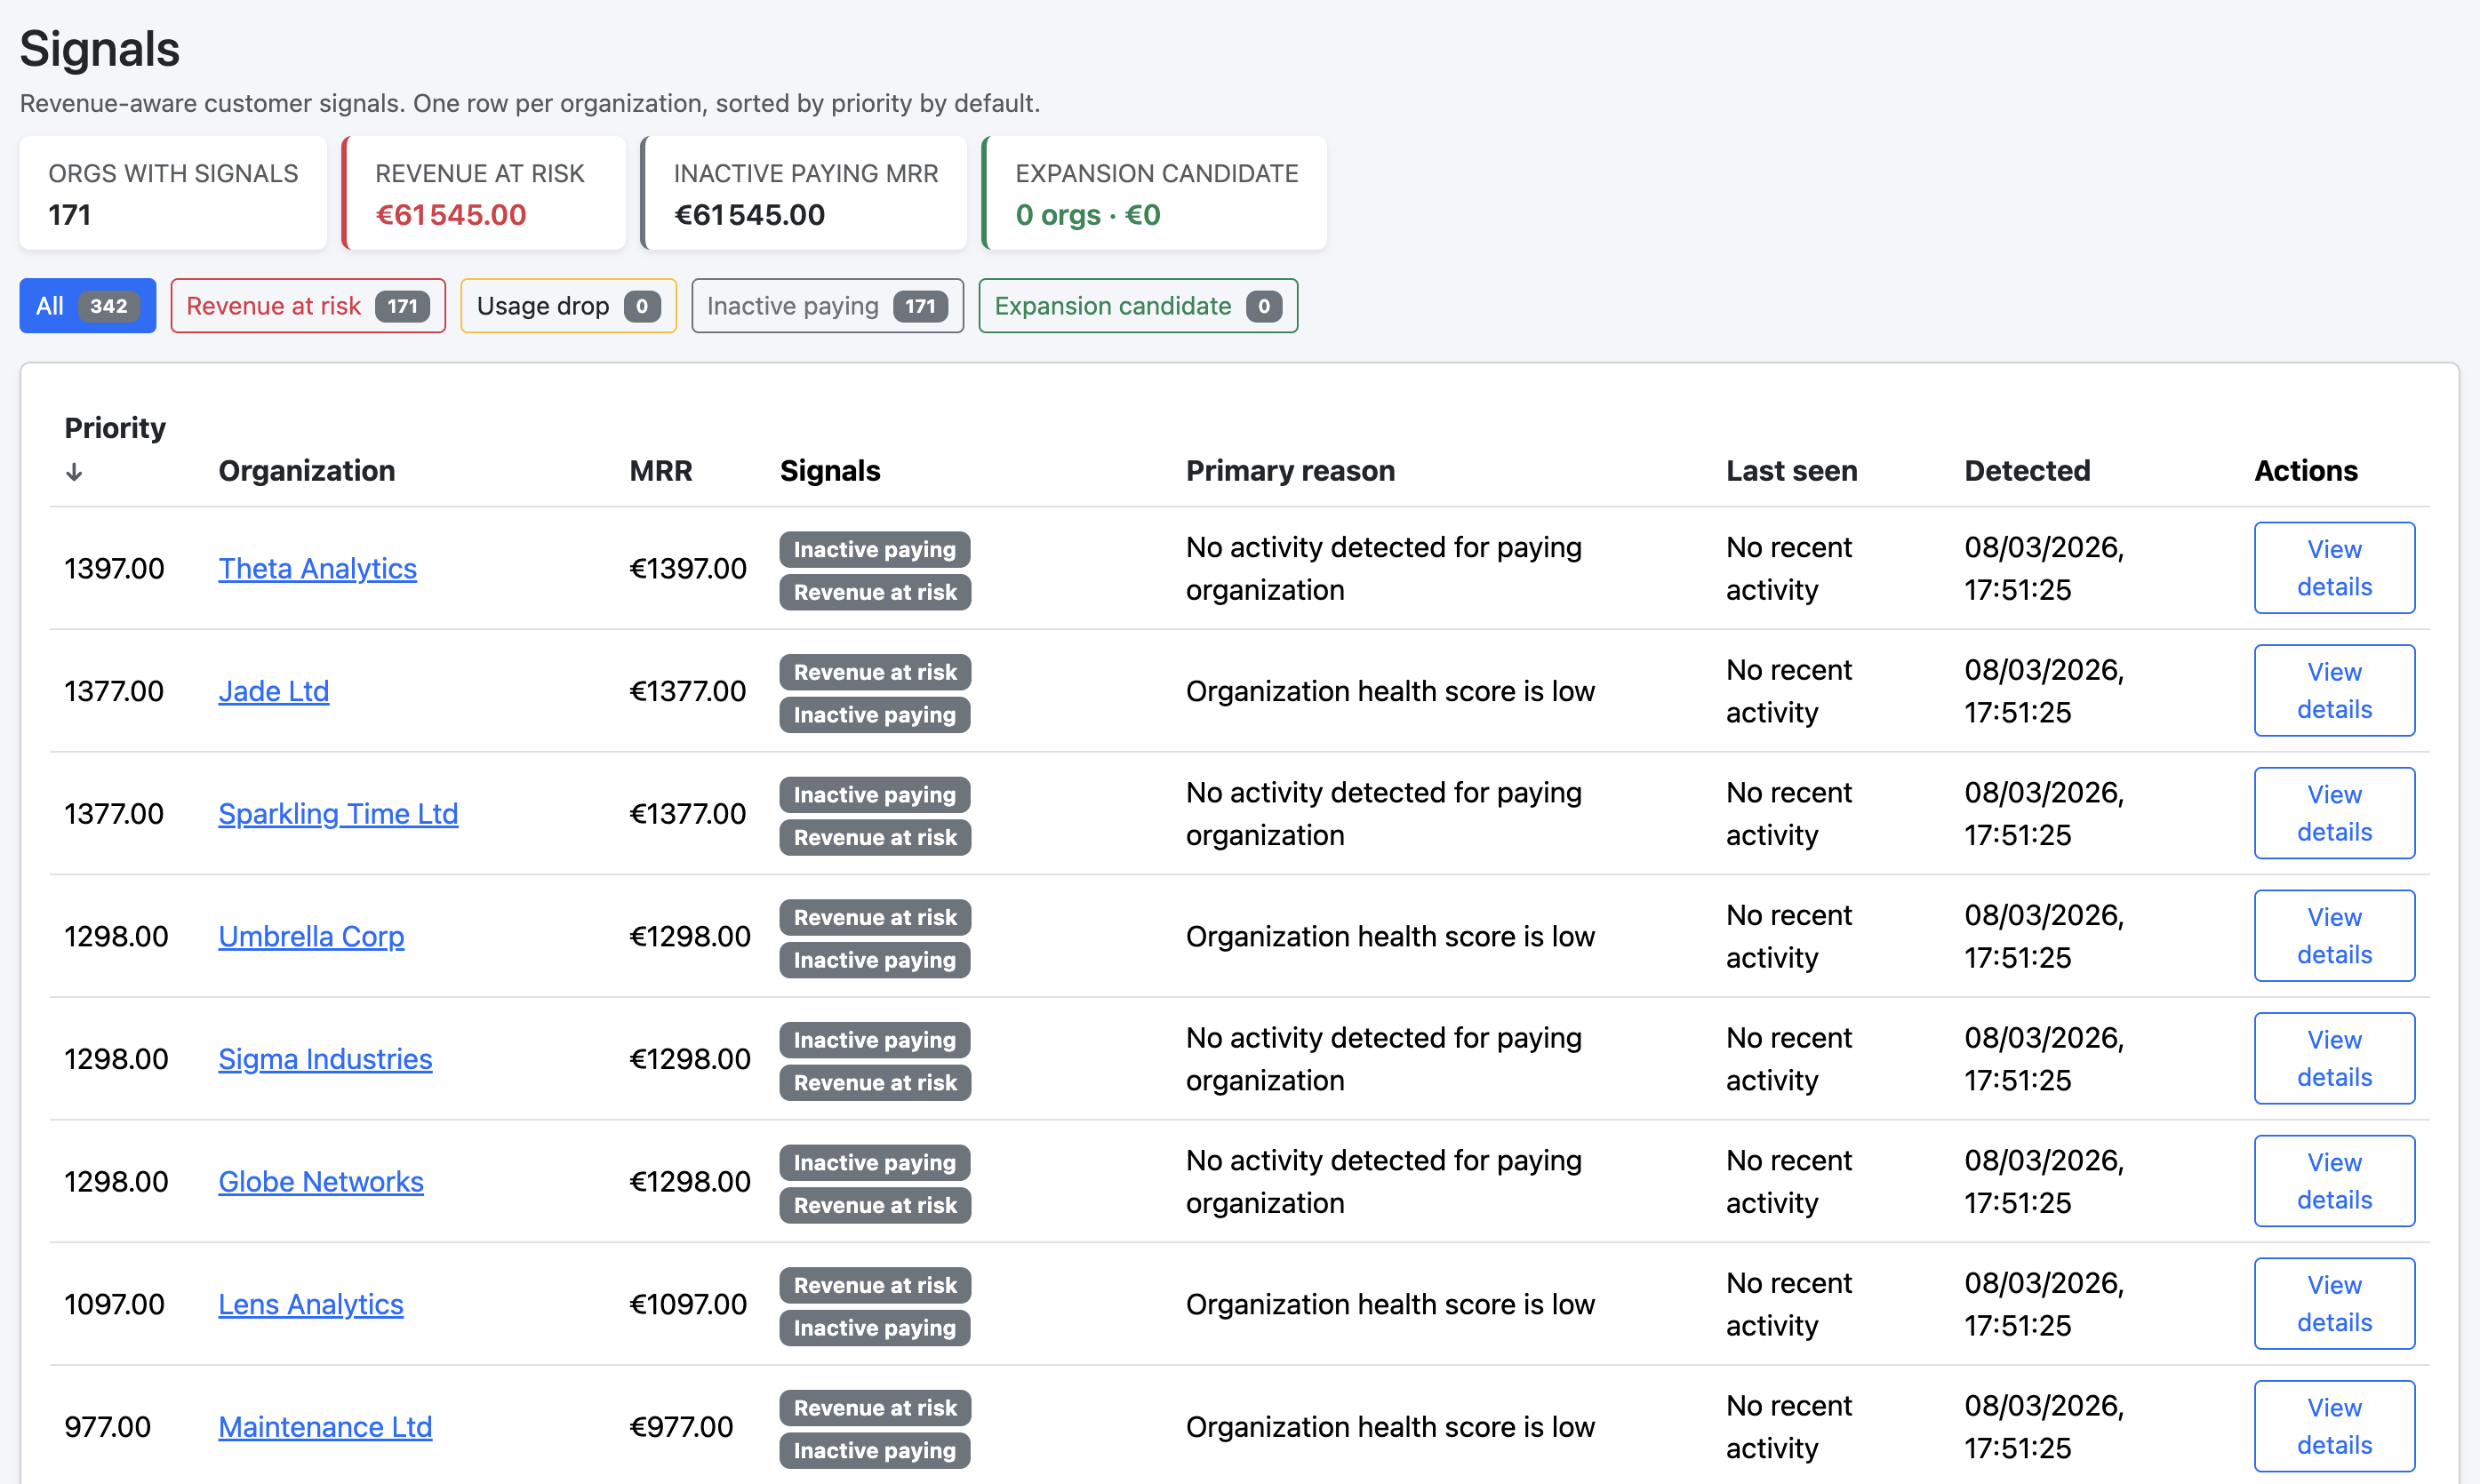
Signals that tell you who to contact
Inactive paying accounts, revenue at risk, and expansion candidates — account lists built from product behavior and revenue context.
- Revenue at risk
- Inactive paying accounts
- Expansion candidates
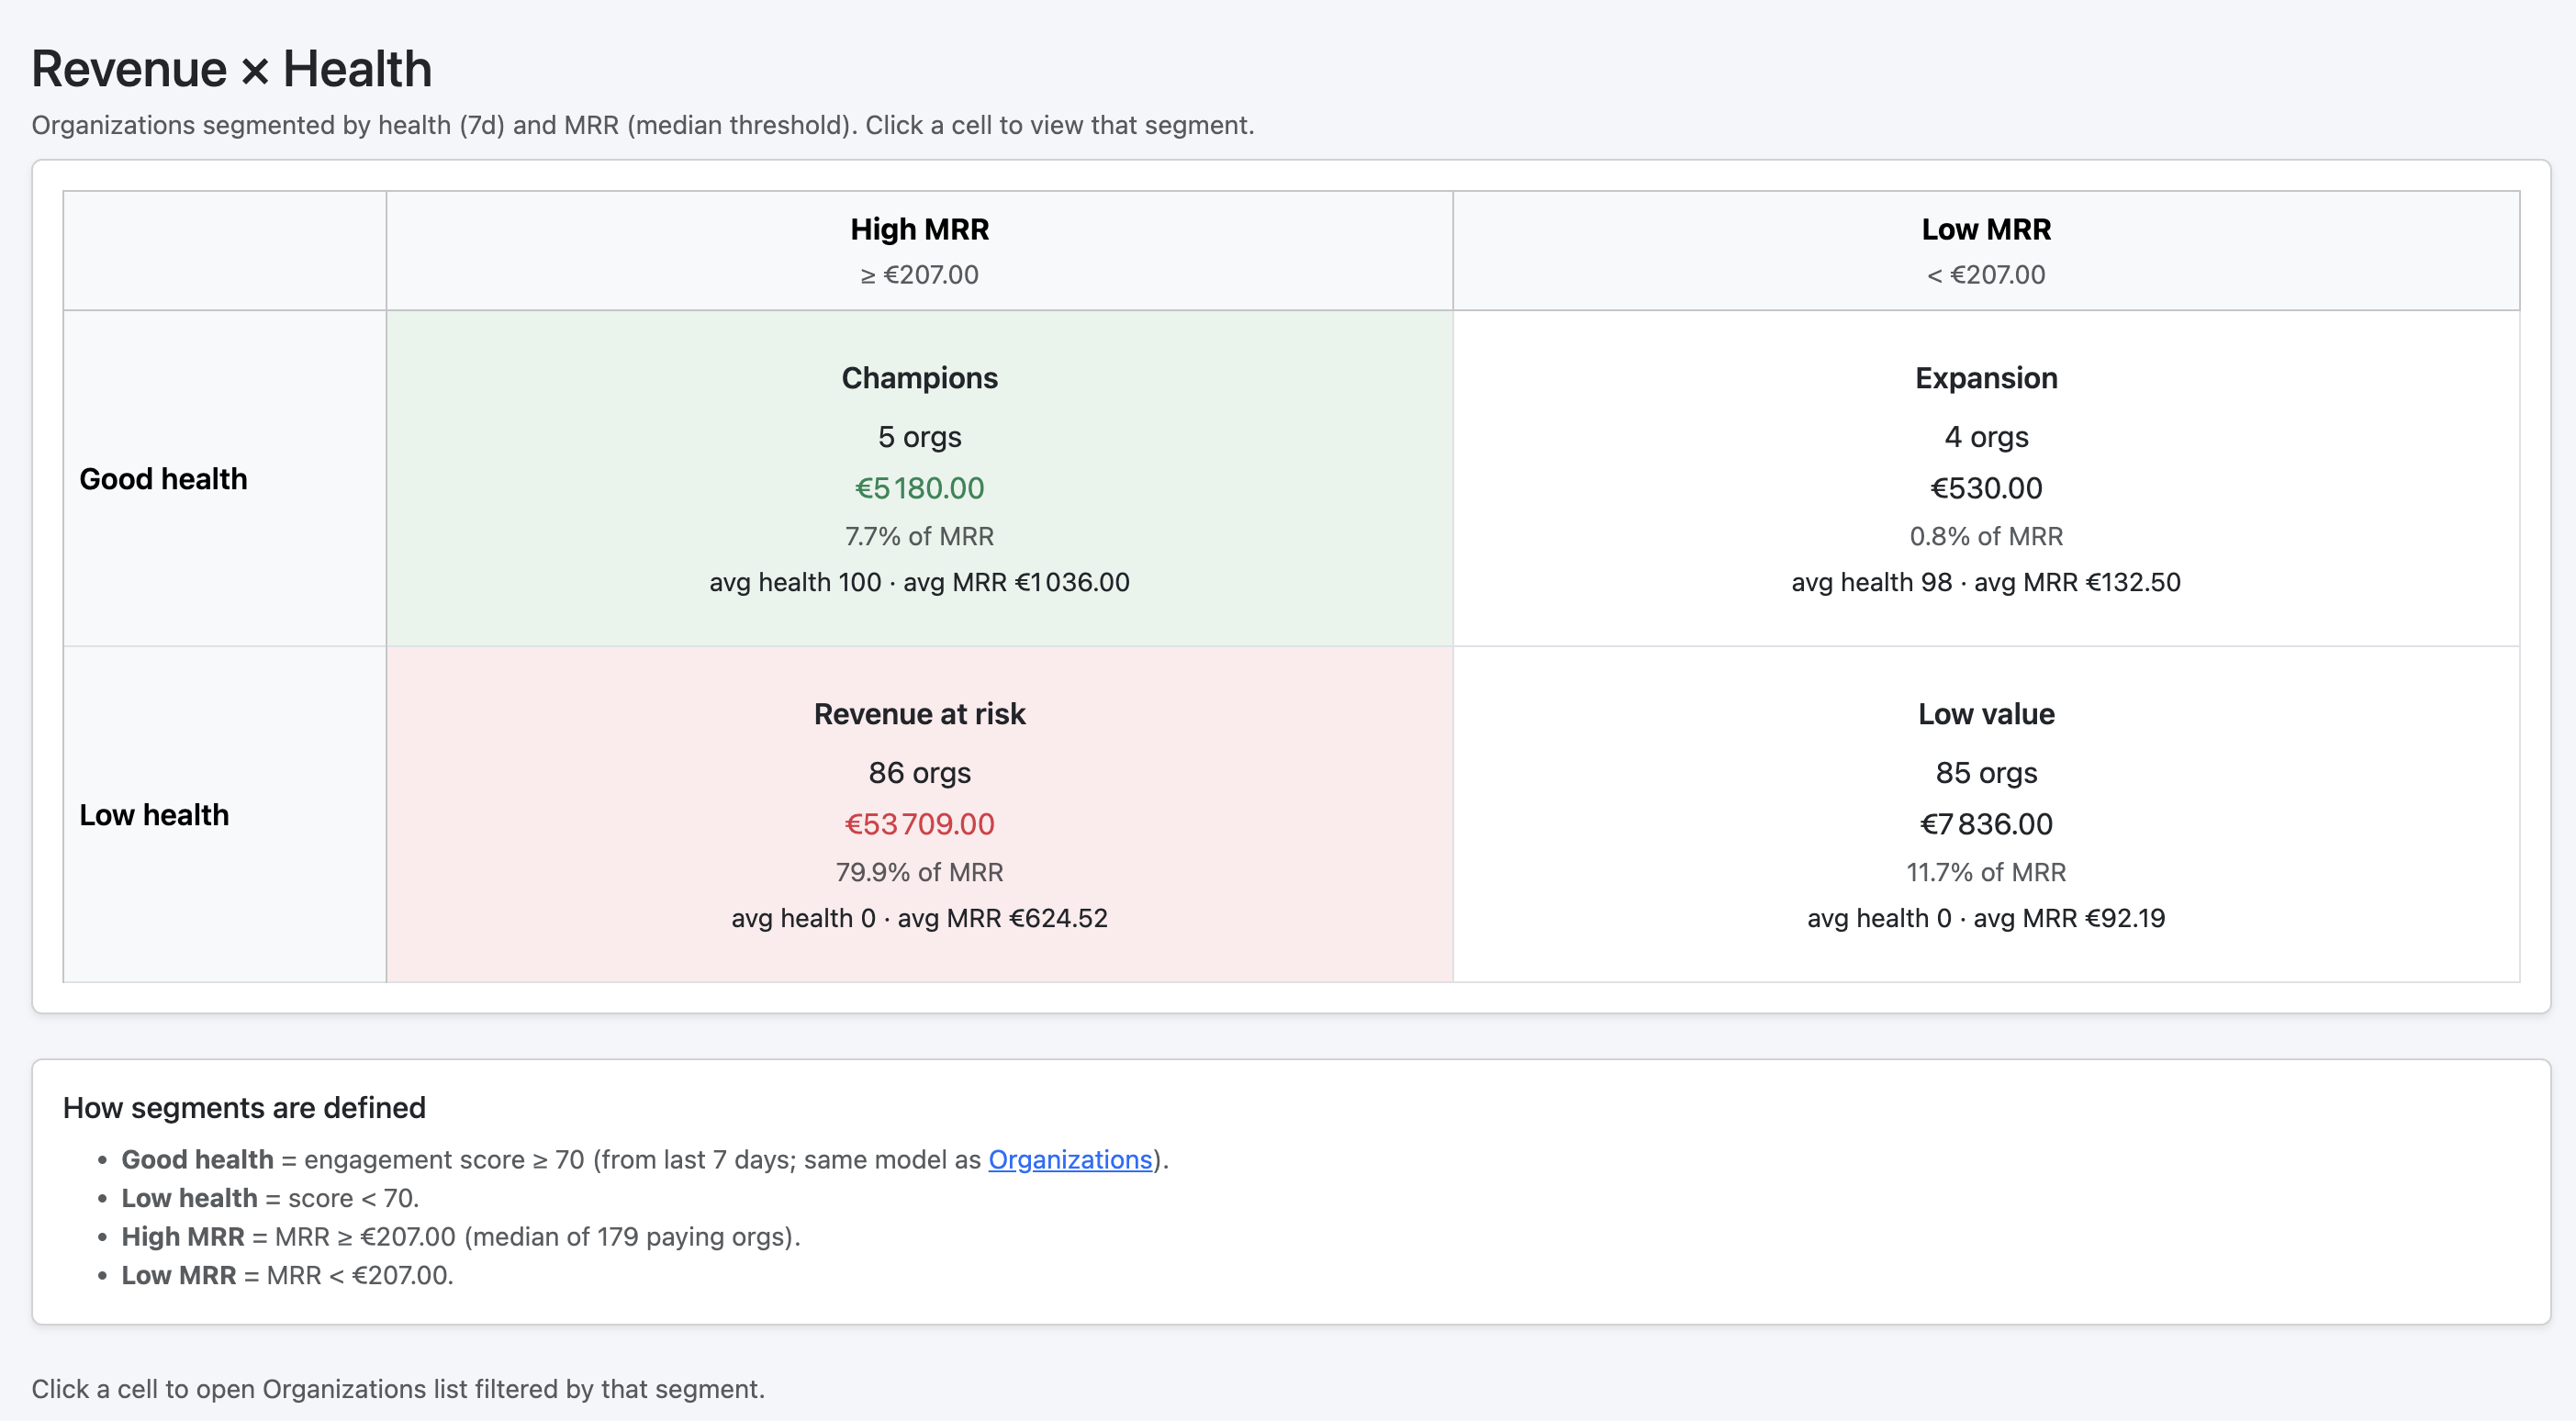
Prioritize by engagement and value
The Revenue × Health matrix separates champions, at-risk revenue, and expansion opportunities — so you focus on the accounts that matter.
- Champions
- At-risk revenue
- Expansion opportunities
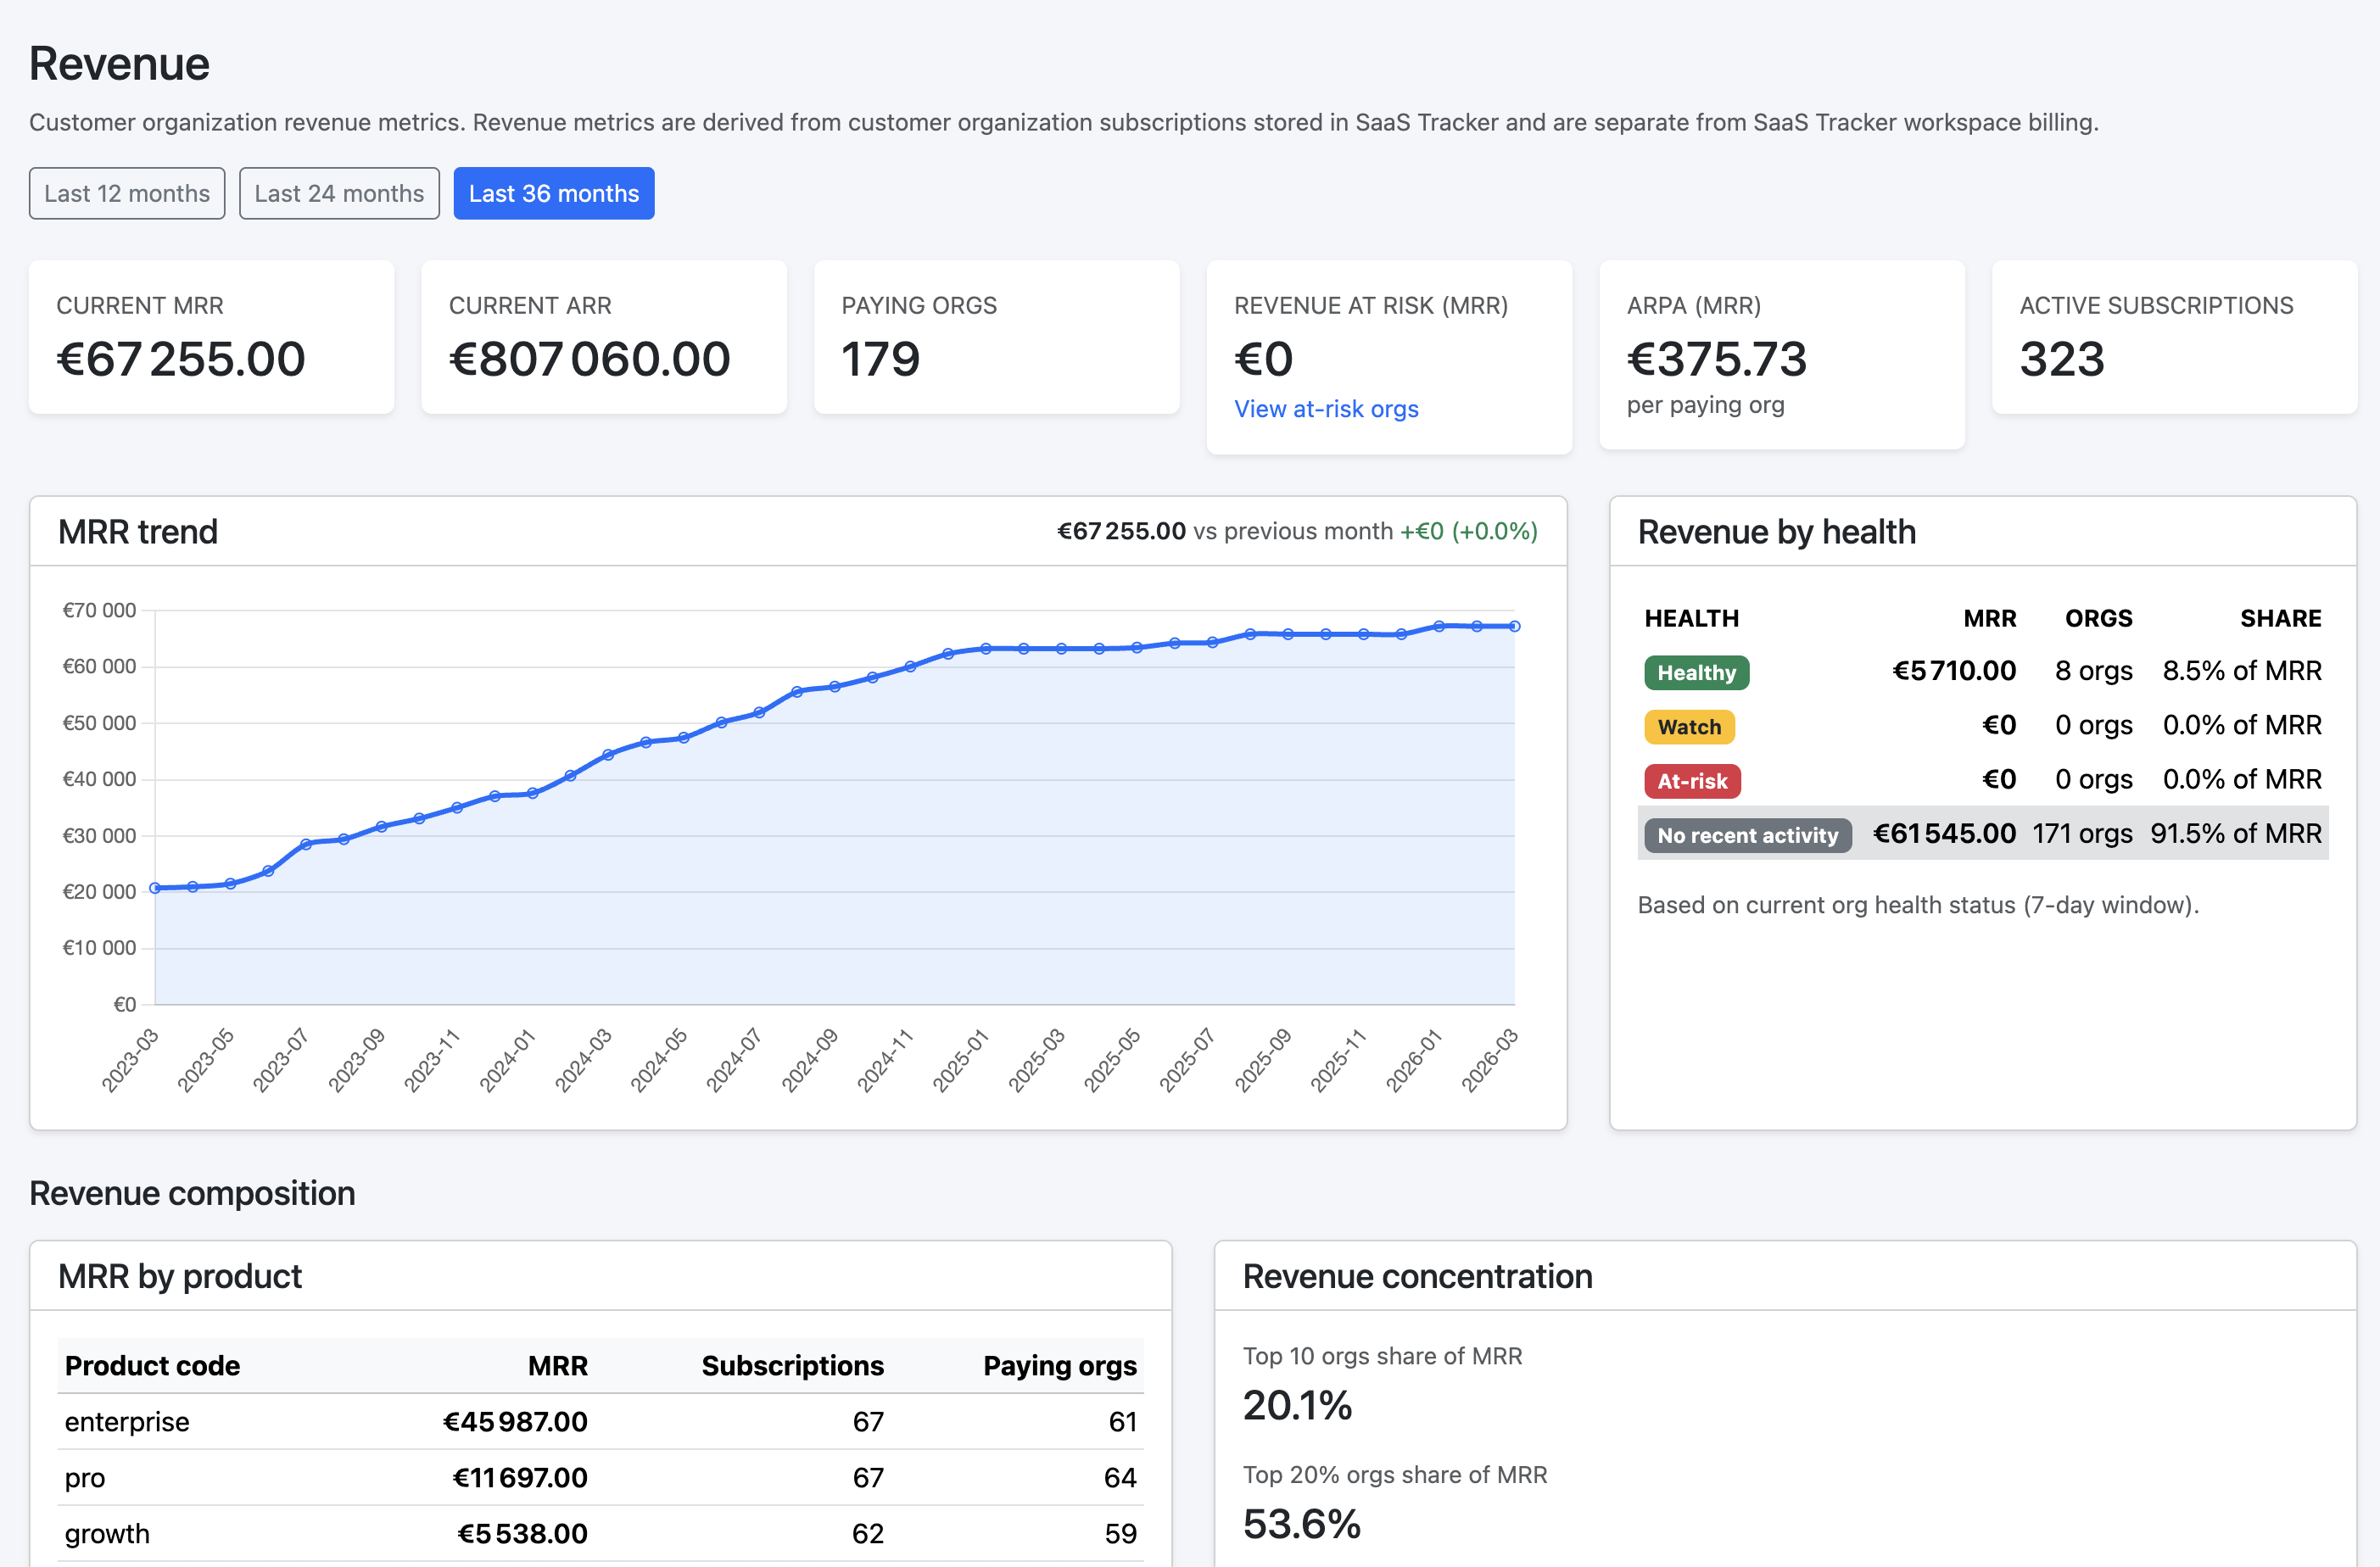
Revenue context beside account behavior
MRR, ARR, and revenue by health segment — so product usage and commercial reality stay in one view.
- MRR and ARR overview
- Revenue by health segment
- Revenue composition and concentration
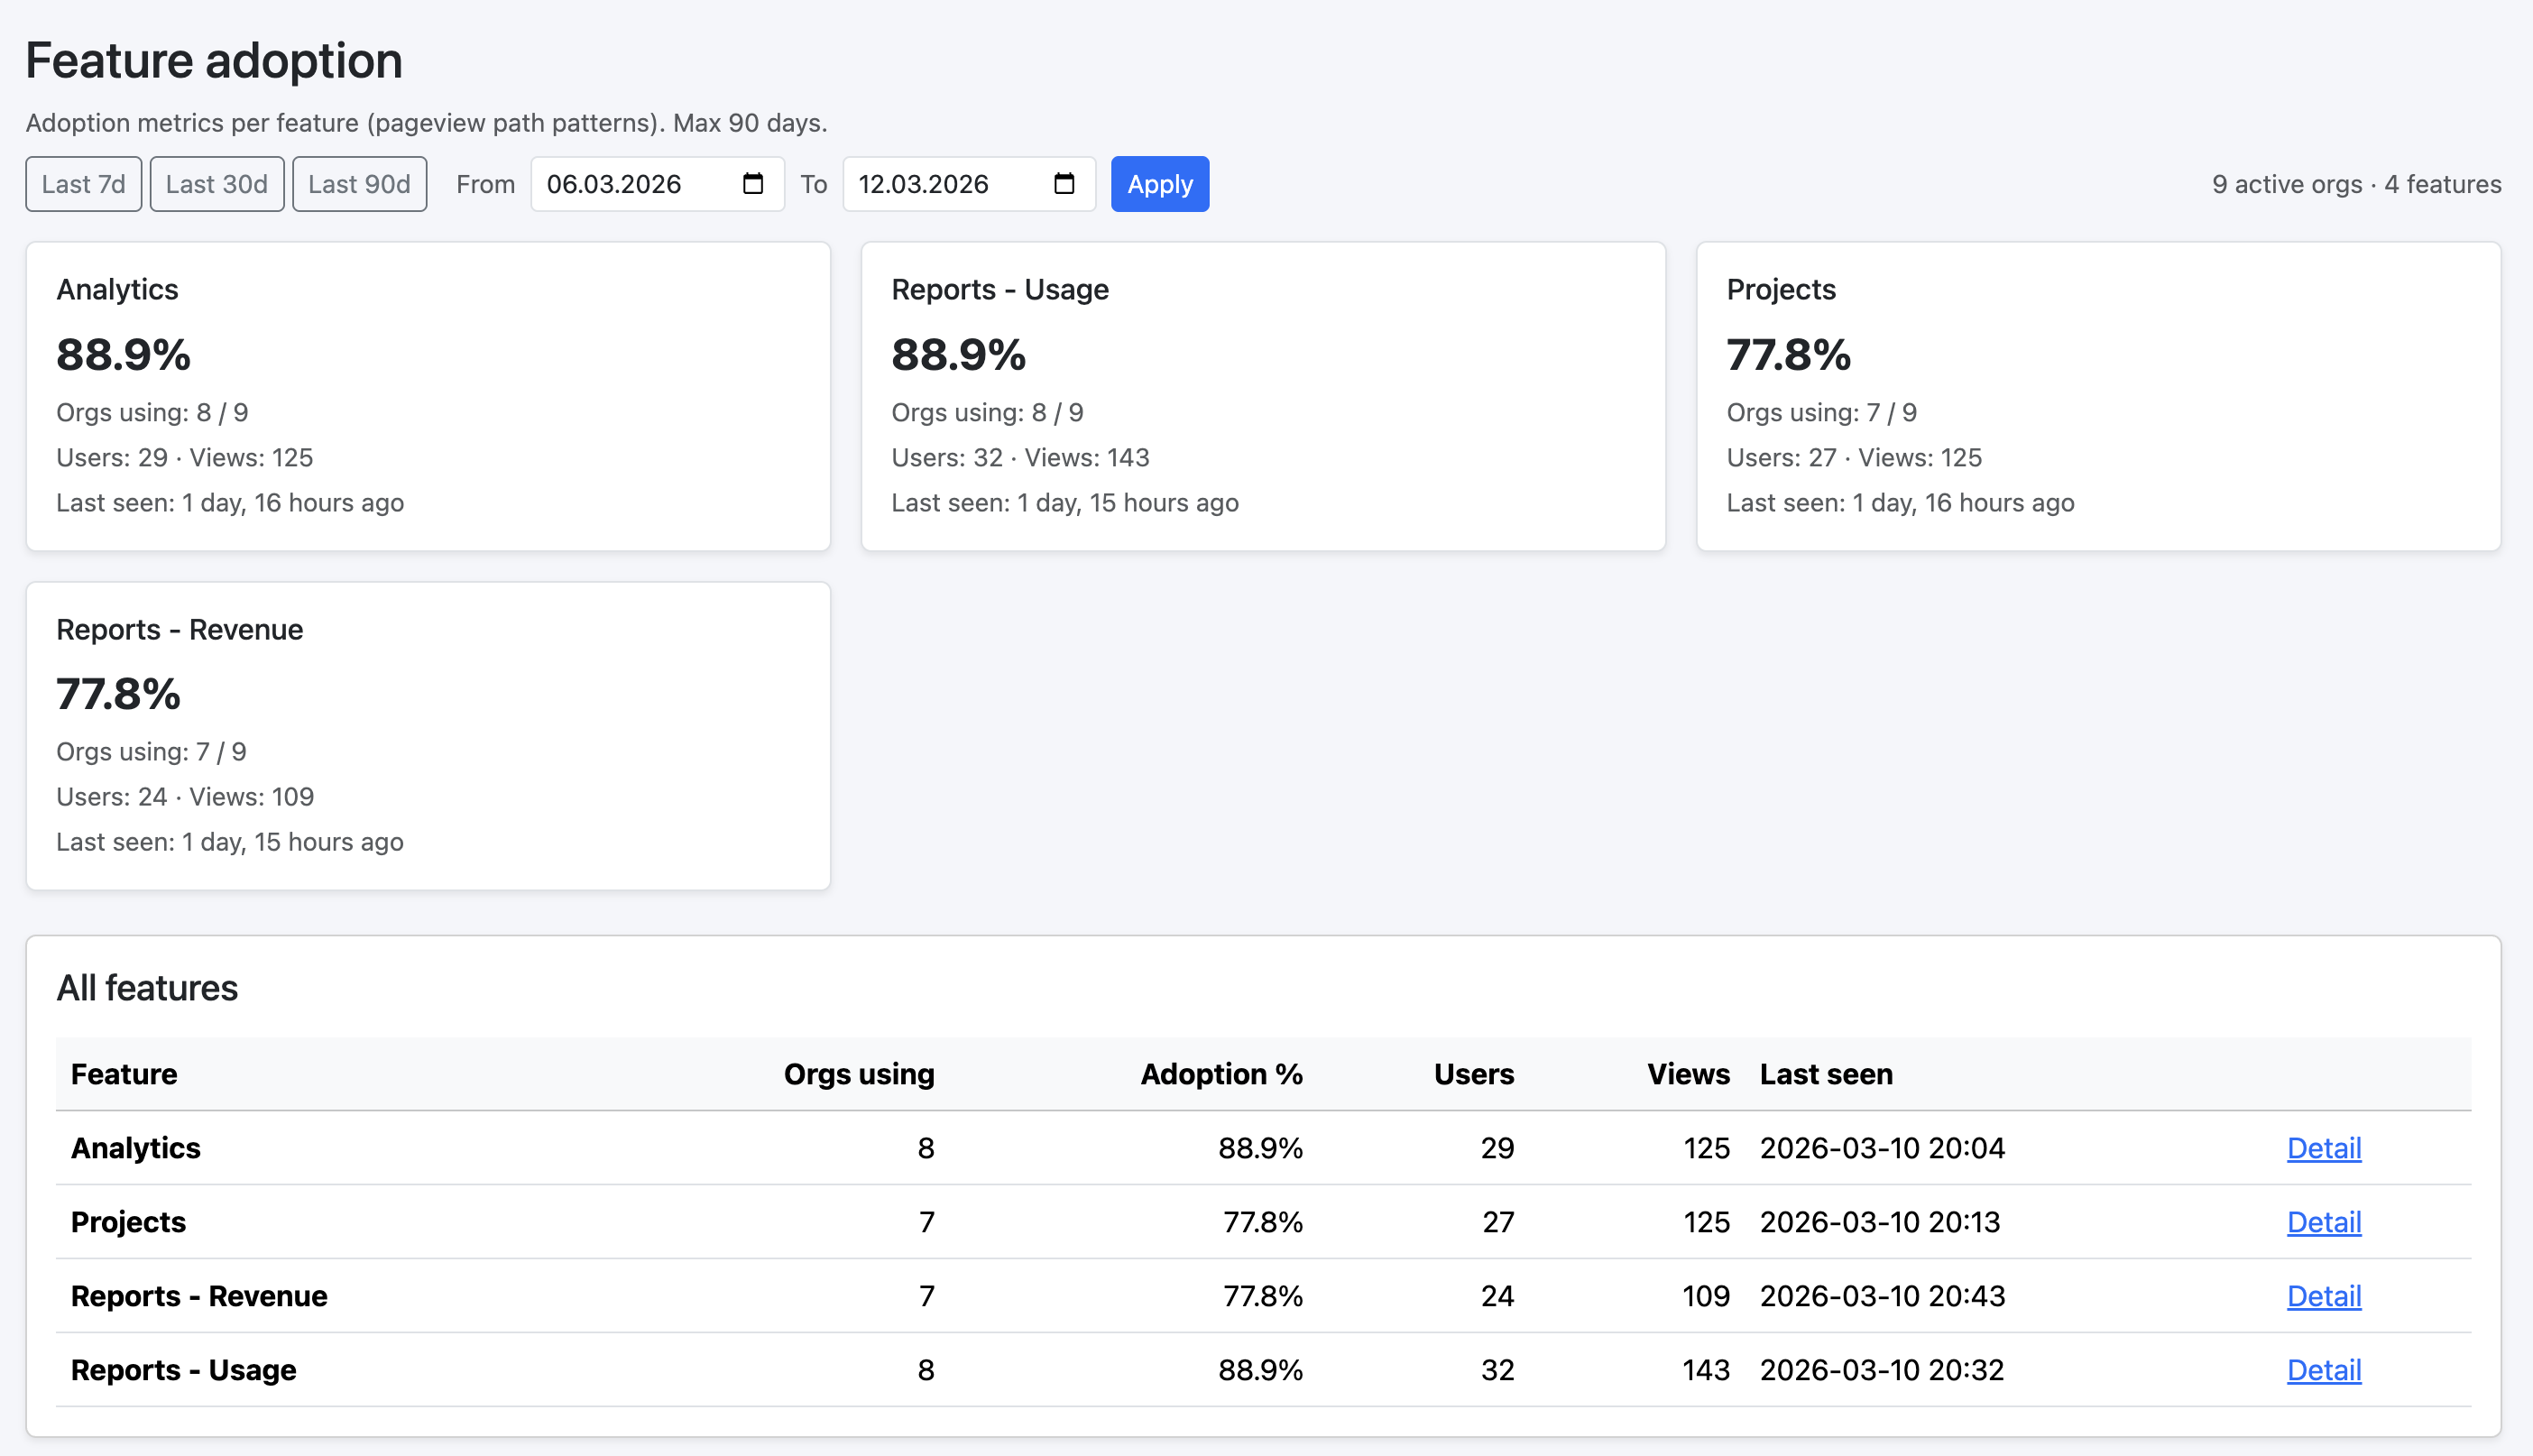
Feature adoption by organization
See which workflows healthy and expanding accounts use — and which at-risk accounts never adopted.
- Feature adoption by customer organization
- Workflow usage patterns
- Adoption trends over time
How it works
Event-based ingestion → account-level aggregation → daily decisions.
Send events
Product actions and AI cost metadata via the Ingest API — pseudonymized identifiers and organization context.
Roll up by account
Usage, health, revenue, and AI cost aggregated per customer organization.
Act on what matters
See which accounts need attention, which features drive value, and where AI margin is at risk.
Privacy-first by design
EU-hosted, metadata-based analytics. AI cost tracking without storing prompts or routing through a gateway.
- ✓ EU-hosted infrastructure
- ✓ GDPR-aligned approach
- ✓ No personal data required
- ✓ Metadata-first AI analytics
See your customer accounts in one cockpit
Setup takes about 30 minutes. The trial starts when your first data arrives — not when you create your account.
Need Growth features? Request a Growth evaluation.